Examples
Basic Examples
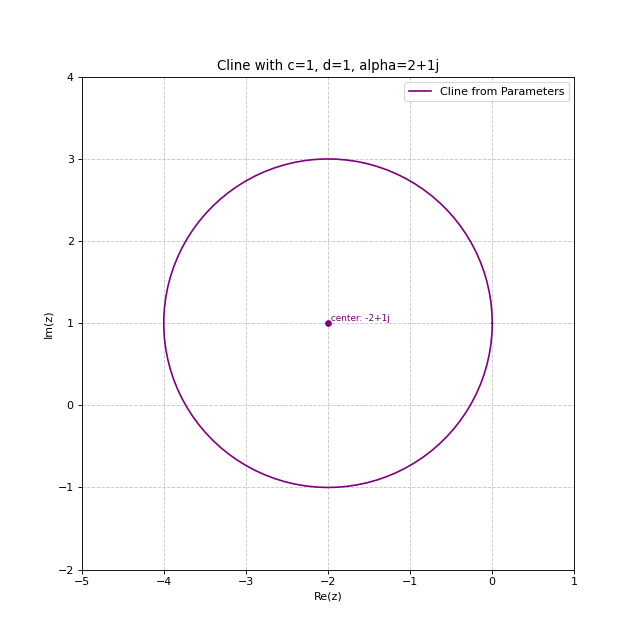
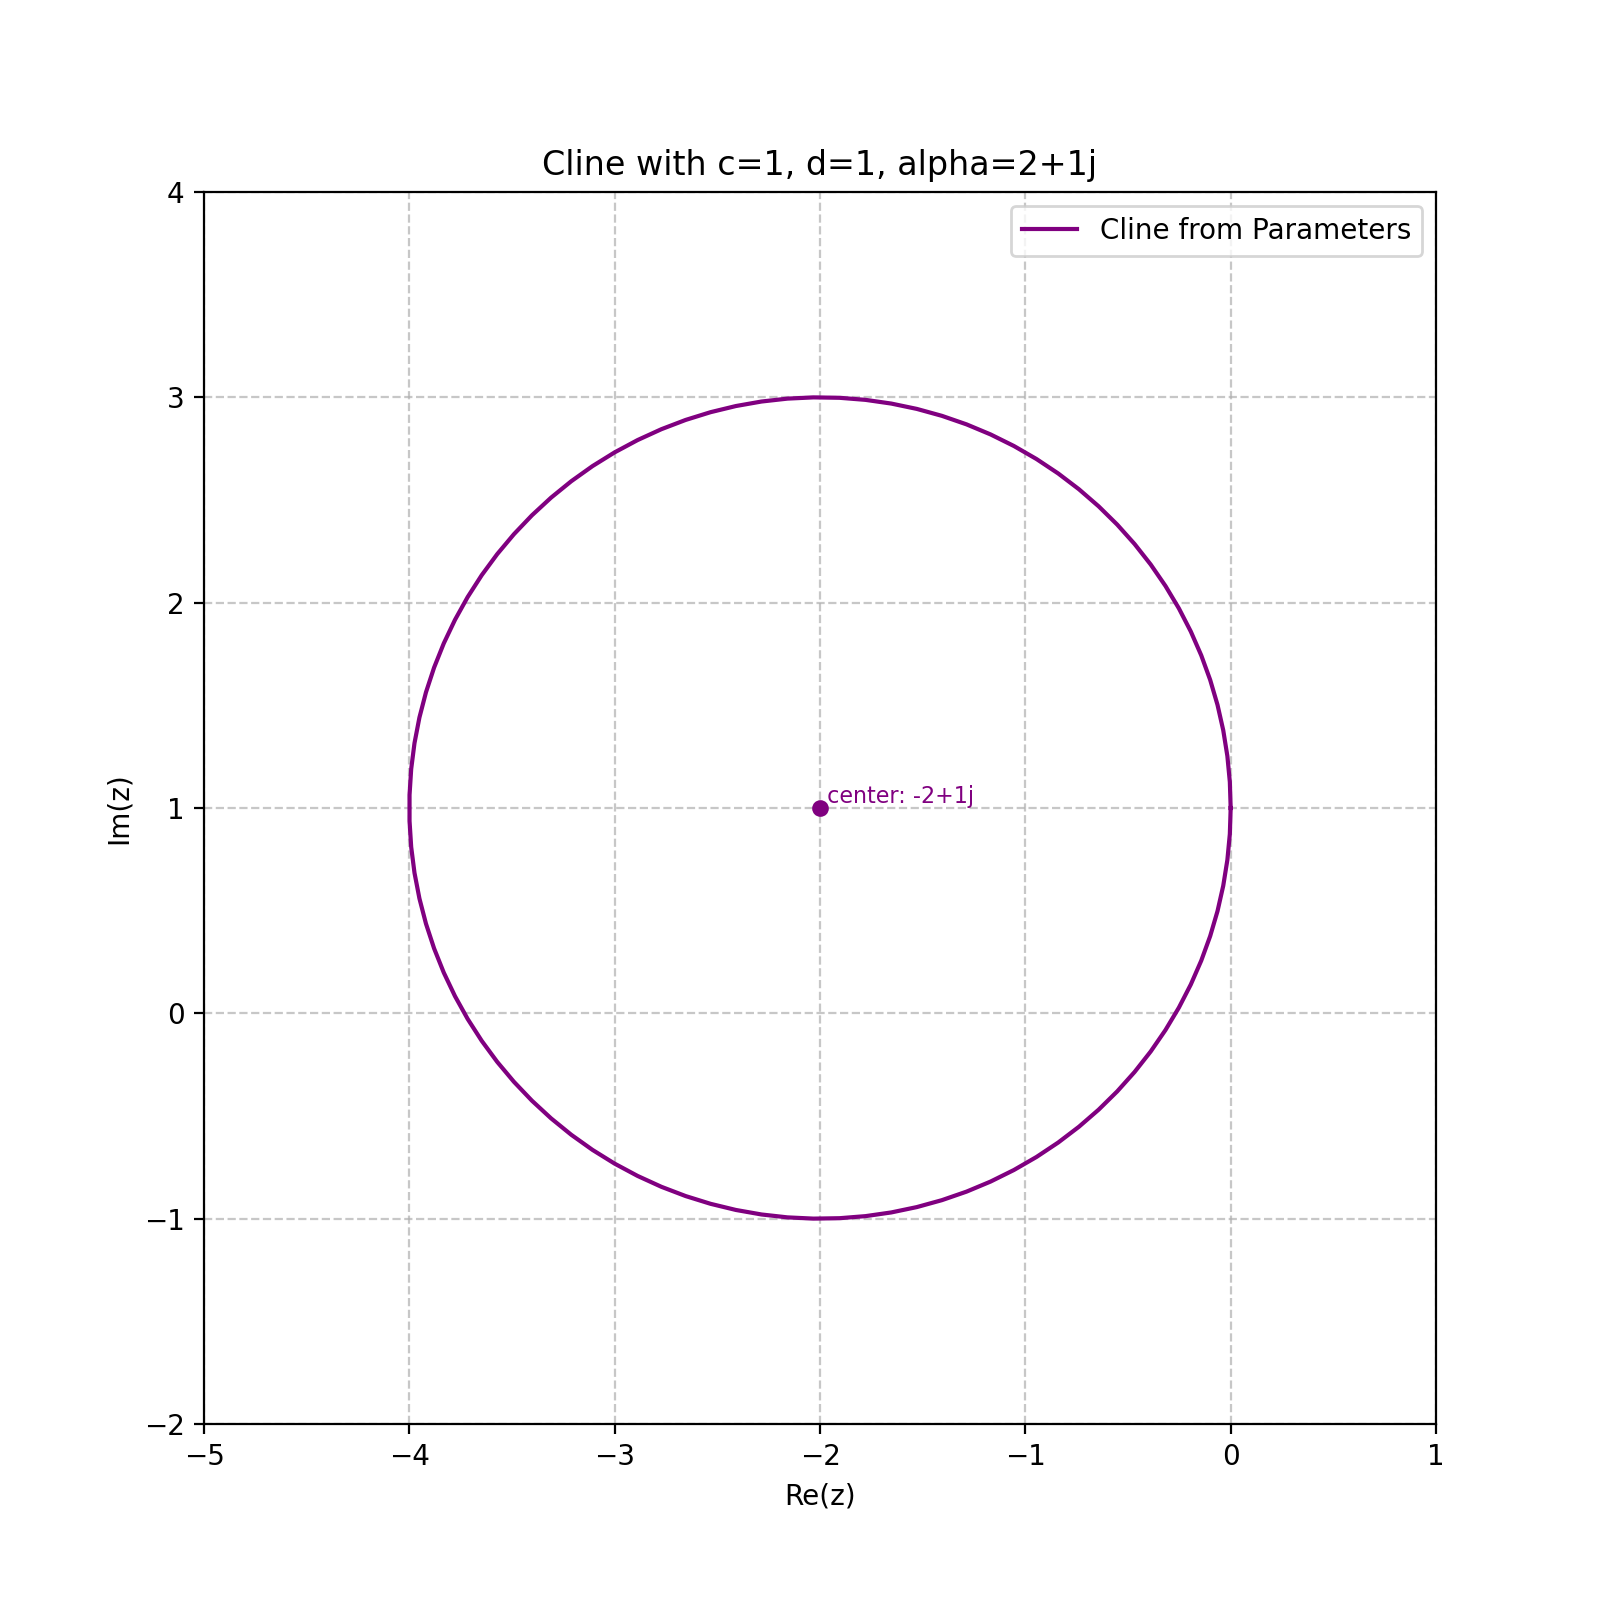
Creating a Cline Directly from Parameters
import matplotlib.pyplot as plt
from cline import Cline

# Create a cline directly by specifying c, alpha, and d parameters
# c=1, d=1, alpha=2+1j
cline = Cline(c=1, alpha=2+1j, d=1)

# Print cline information
print(cline)

# Create plot
fig, ax = plt.subplots(figsize=(8, 8))
cline.plot(ax=ax, color='purple', label='Cline from Parameters')

ax.grid(True, linestyle='--', alpha=0.7)
plt.legend()
plt.title('Cline with c=1, d=1, alpha=2+1j')
(Source code, png, hires.png, pdf)

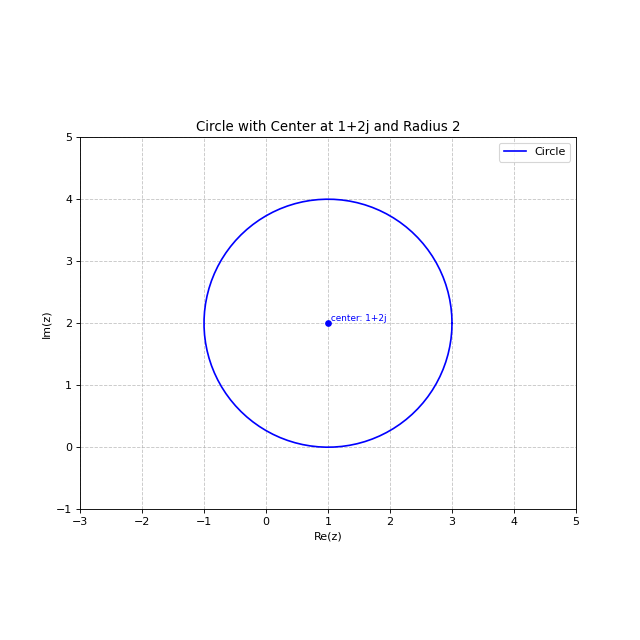
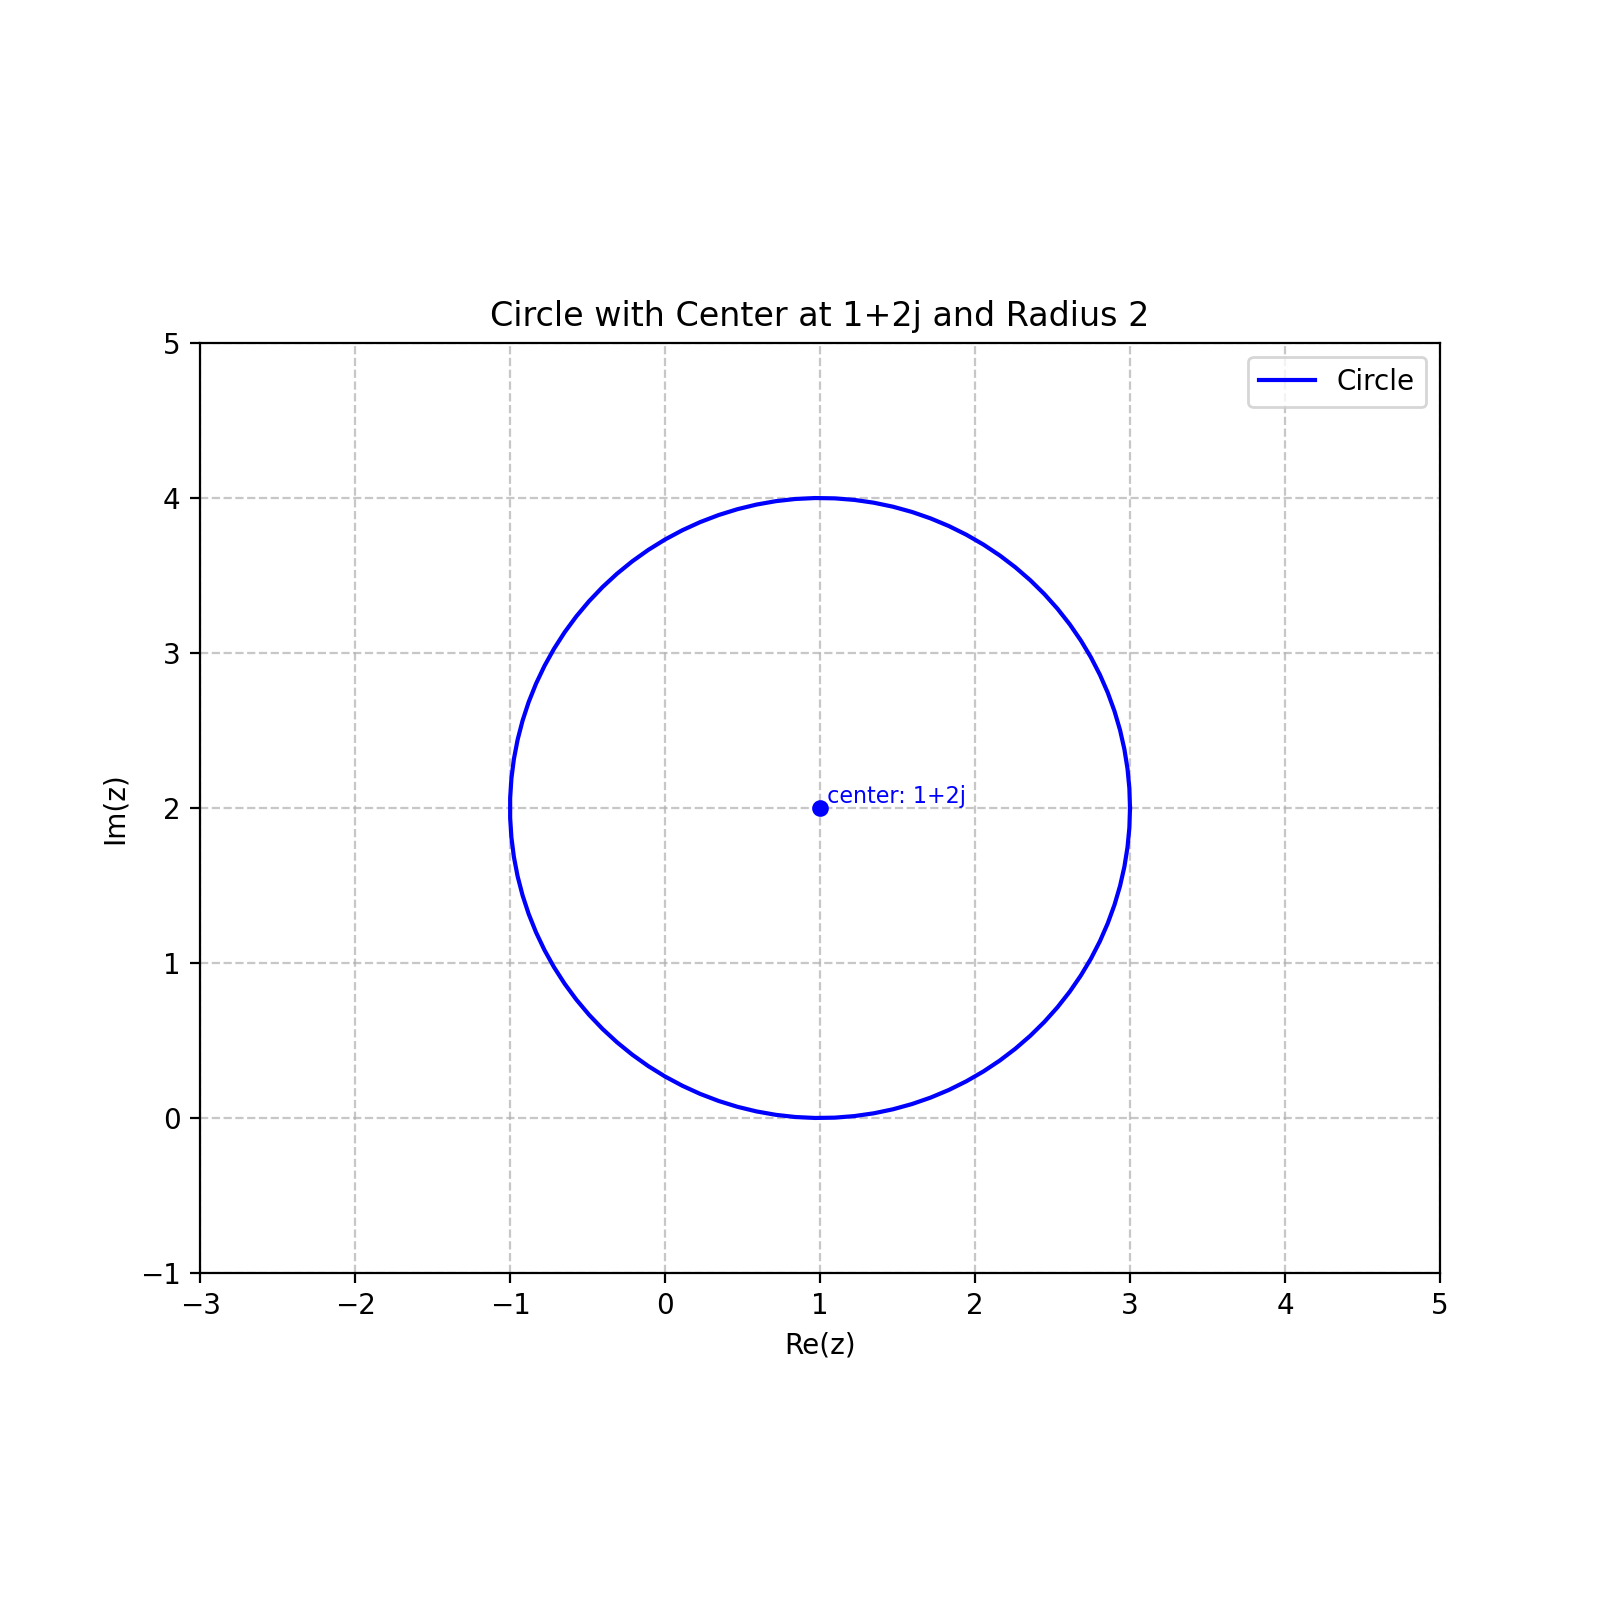
Creating and Visualizing Circles
import matplotlib.pyplot as plt
from cline import Cline

# Create a circle with center at 1+2j and radius 2
circle = Cline.from_circle(center=1+2j, radius=2)

# Print circle information (only shown in code, not in output)
print(circle)

# Create plot
fig, ax = plt.subplots(figsize=(8, 8))
circle.plot(ax=ax, color='blue', label='Circle')

# Set limits and add legend
ax.set_xlim(-3, 5)
ax.set_ylim(-1, 5)
ax.grid(True, linestyle='--', alpha=0.7)
plt.legend()
plt.title('Circle with Center at 1+2j and Radius 2')
(Source code, png, hires.png, pdf)

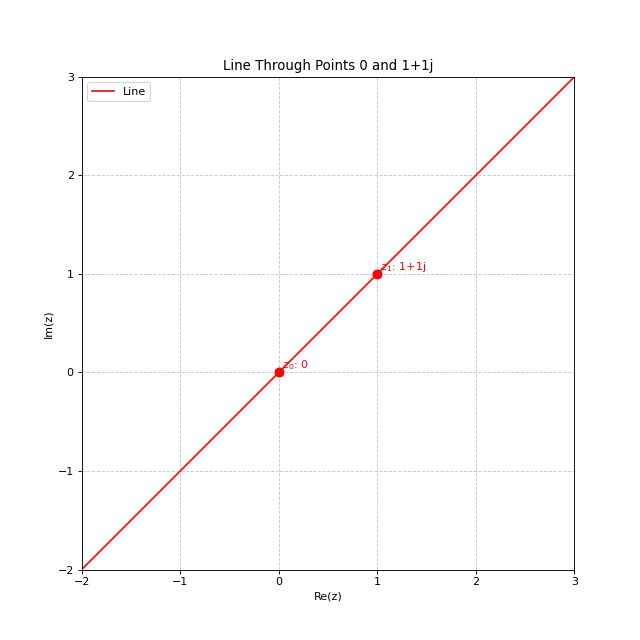
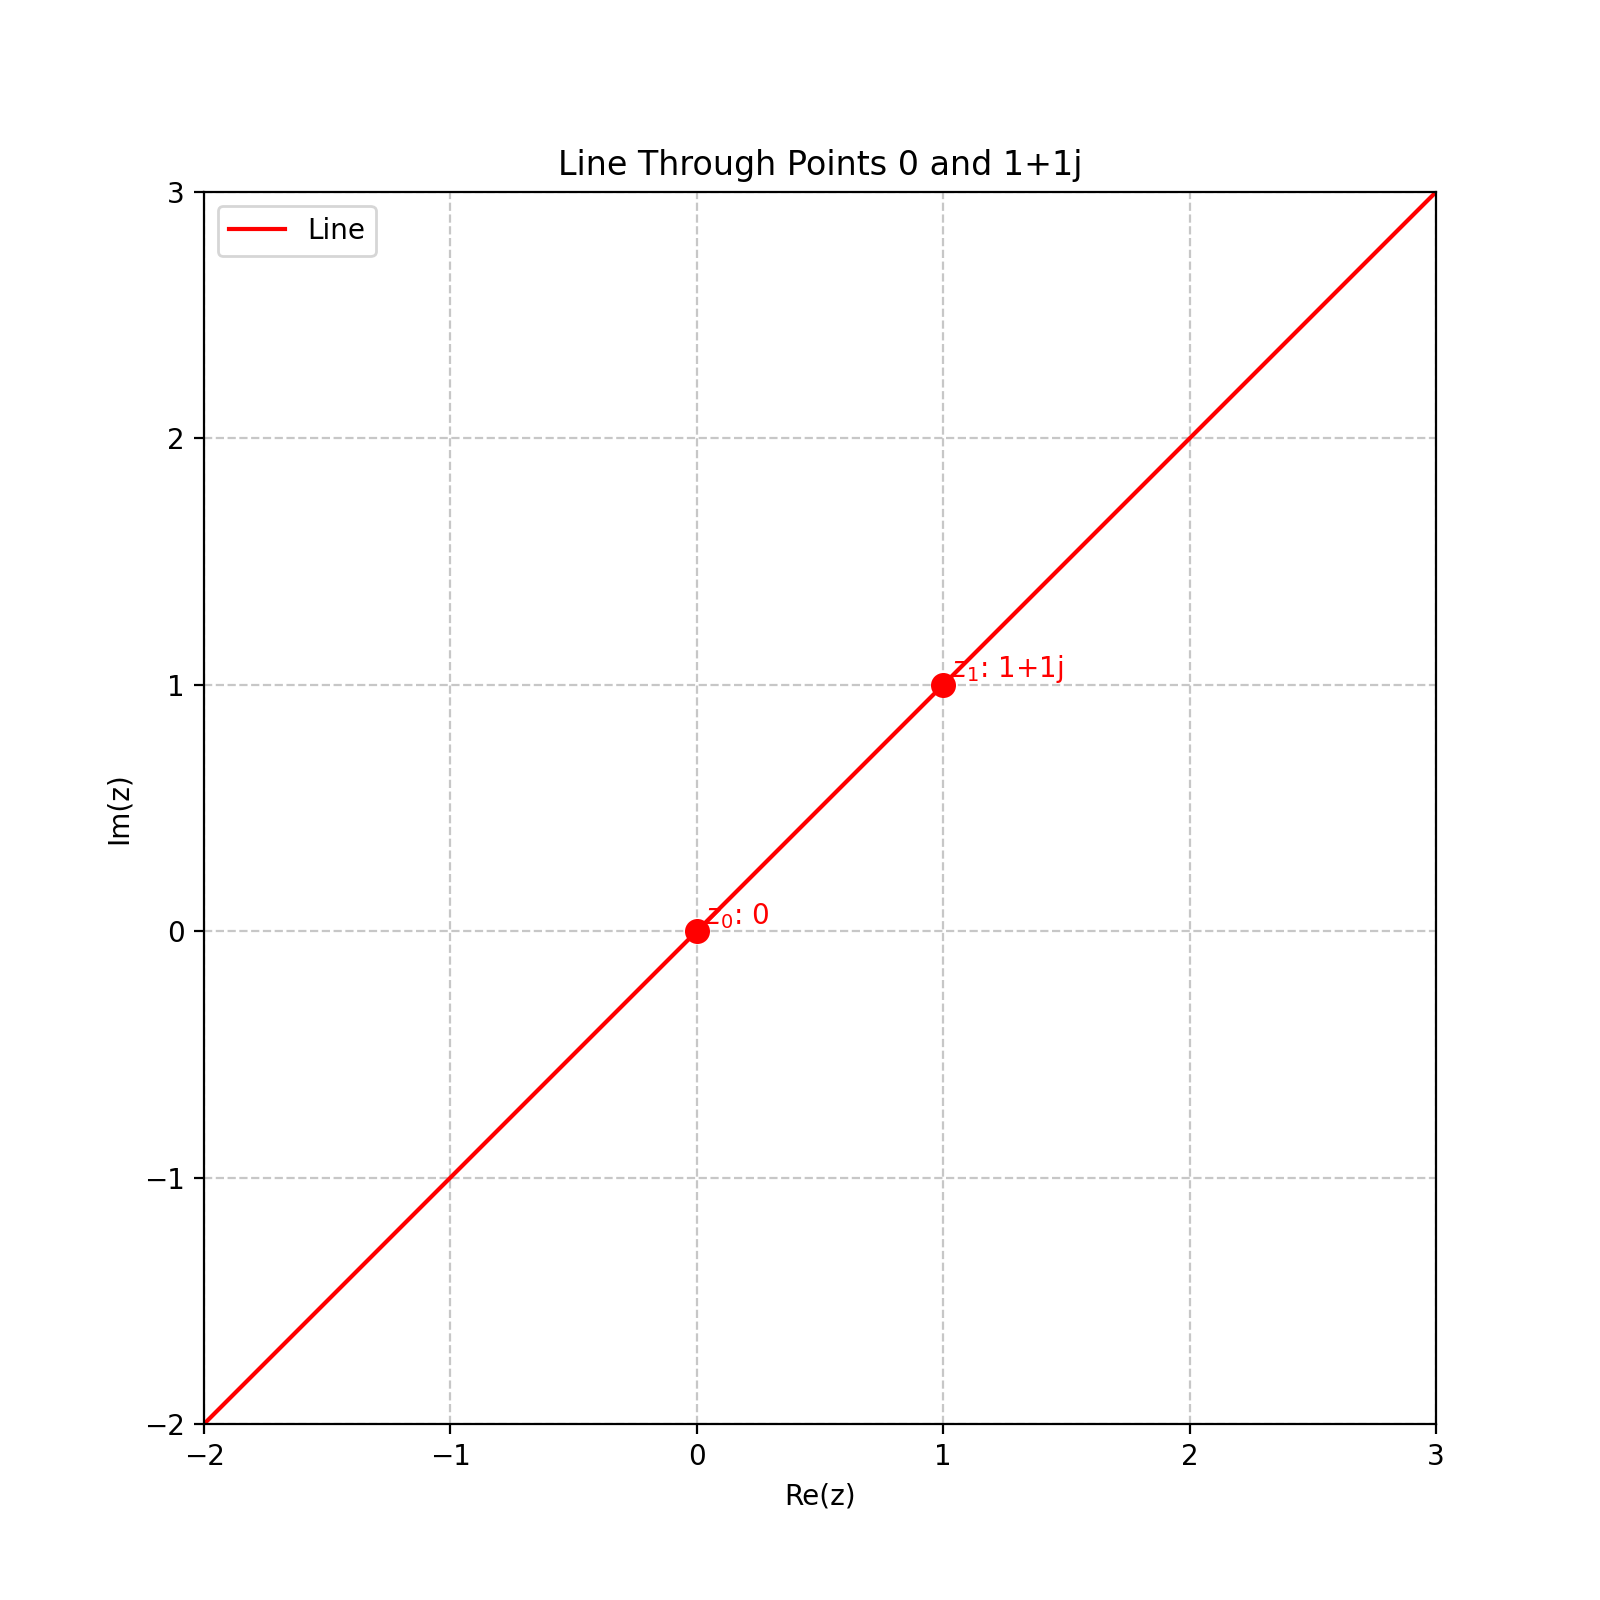
Creating and Visualizing Lines
import matplotlib.pyplot as plt
from cline import Cline

# Create a line passing through points 0 and 1+1j
line = Cline.from_line(z0=0, z1=1+1j)

# Create plot - the limits are now automatically calculated
# based on the points used to create the line
fig, ax = plt.subplots(figsize=(8, 8))
line.plot(ax=ax, color='red', label='Line', show_points=True)
plt.legend()
plt.title('Line Through Points 0 and 1+1j')
(Source code, png, hires.png, pdf)

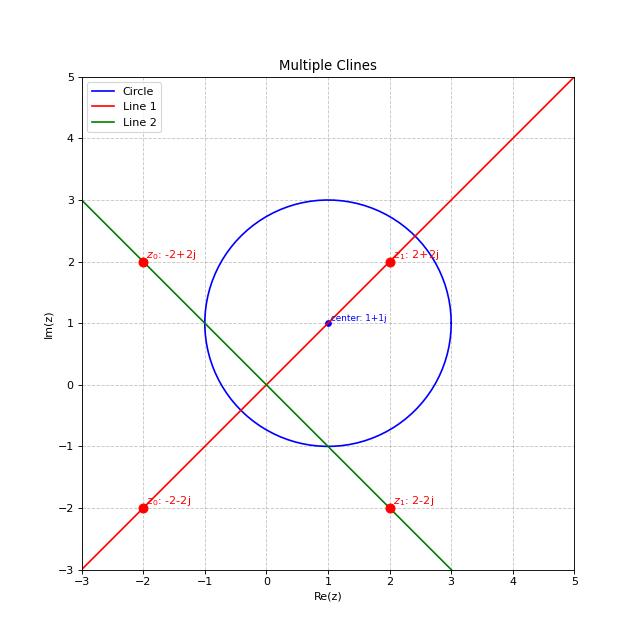
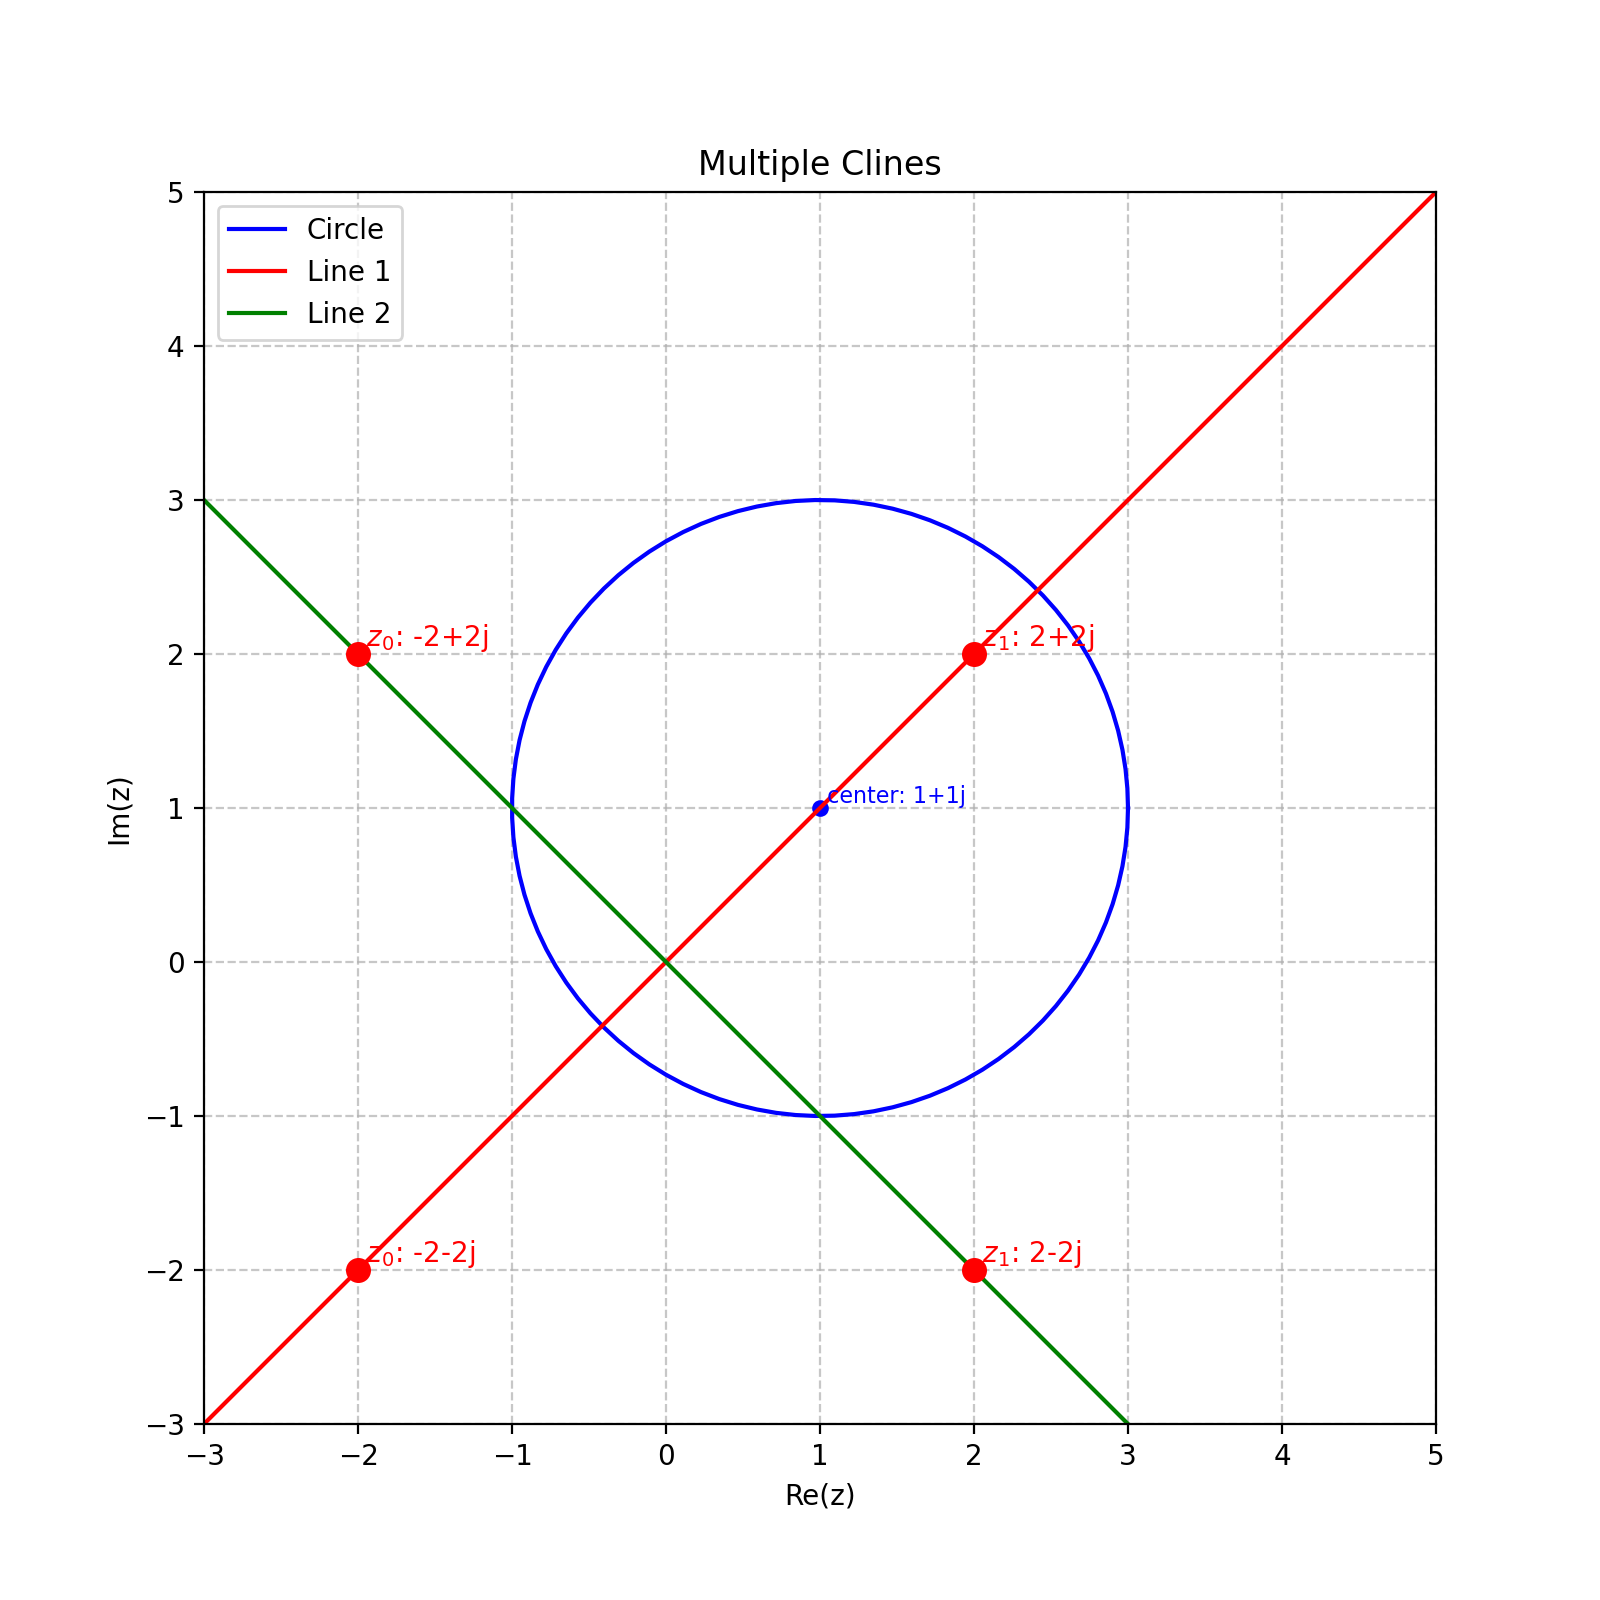
Combining Multiple Clines
import matplotlib.pyplot as plt
from cline import Cline

# Create multiple clines
circle = Cline.from_circle(center=1+1j, radius=2)
line1 = Cline.from_line(z0=-2-2j, z1=2+2j)
line2 = Cline.from_line(z0=-2+2j, z1=2-2j)

# Create plot
fig, ax = plt.subplots(figsize=(8, 8))

# Plot the clines
circle.plot(ax=ax, color='blue', label='Circle')
line1.plot(ax=ax, color='red', label='Line 1')
line2.plot(ax=ax, color='green', label='Line 2')

# Set limits and add legend
ax.set_xlim(-3, 5)
ax.set_ylim(-3, 5)
ax.grid(True, linestyle='--', alpha=0.7)
ax.set_aspect('equal')
plt.legend()
plt.title('Multiple Clines')
(Source code, png, hires.png, pdf)

Advanced Examples
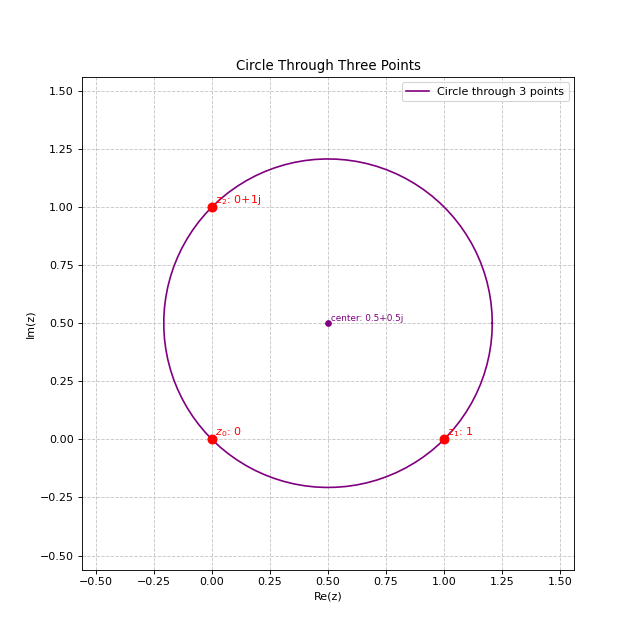
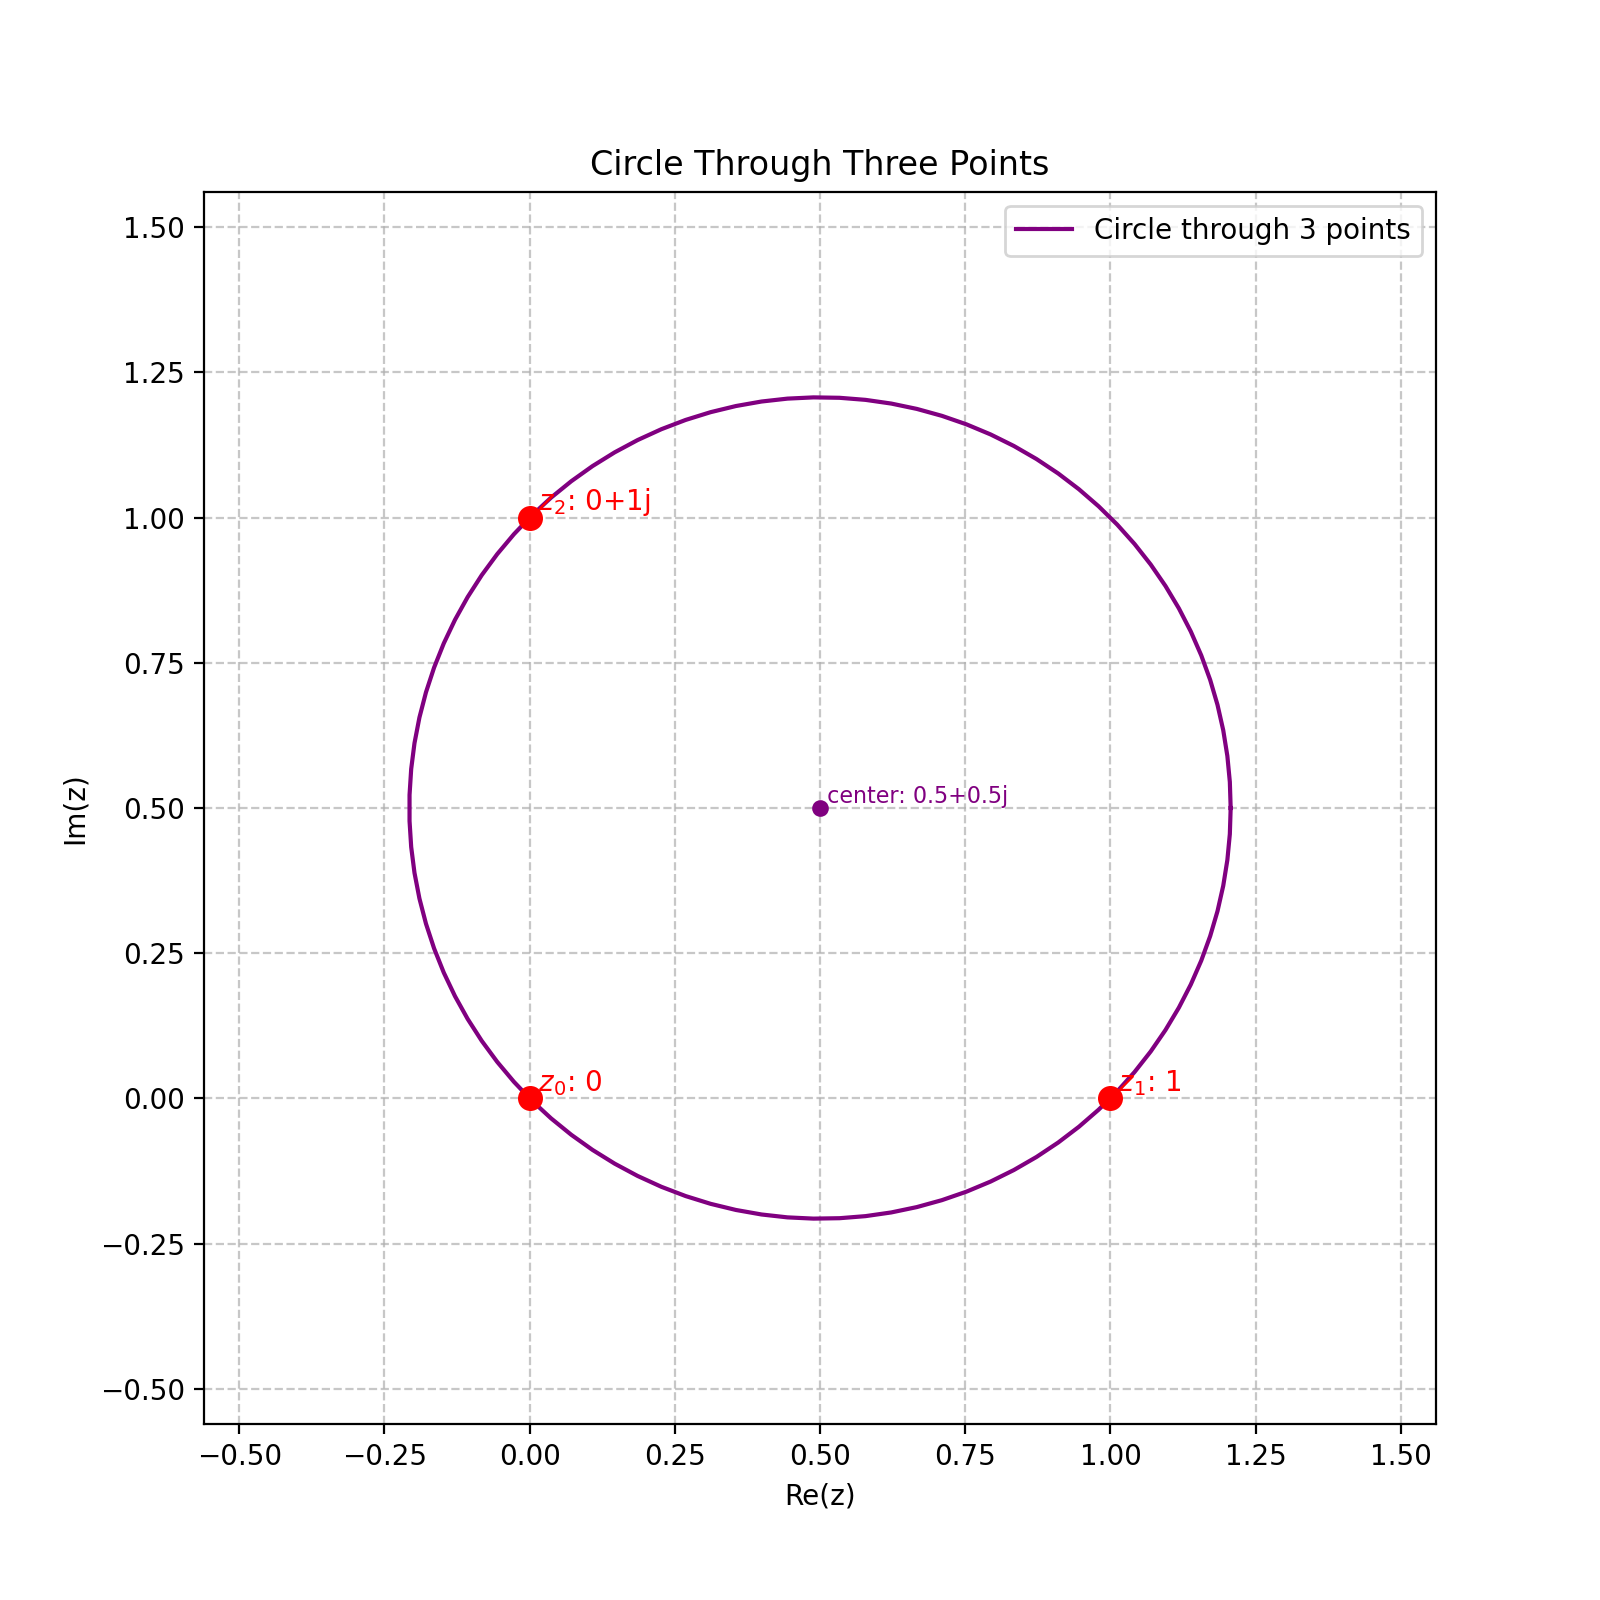
Circle Through Three Points
import matplotlib.pyplot as plt
from cline import Cline

# Create three points in the complex plane
z0 = 0
z1 = 1
z2 = 1j

# Create a cline passing through these three points
cline = Cline.from_three_points(z0, z1, z2)

# Create plot with automatic limits
fig, ax = plt.subplots(figsize=(8, 8))
cline.plot(ax=ax, color='purple', label='Circle through 3 points', show_points=True)
plt.legend()
plt.title('Circle Through Three Points')
(Source code, png, hires.png, pdf)

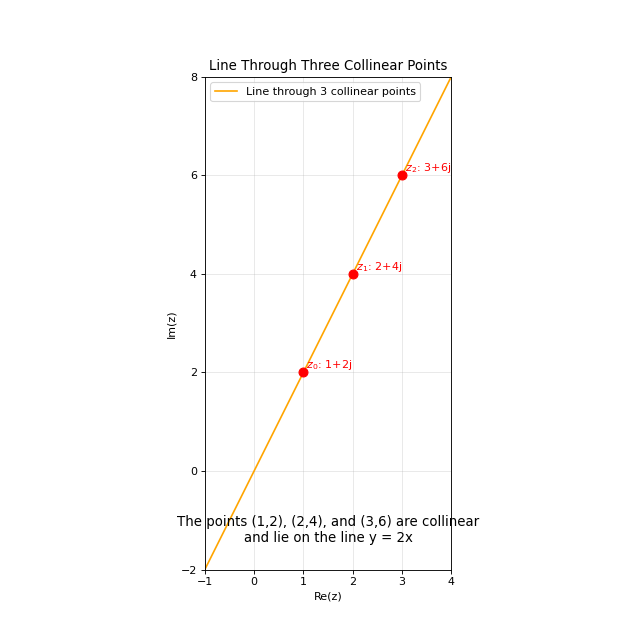
Line Through Three Collinear Points
import matplotlib.pyplot as plt
from cline import Cline

# Create three collinear points (these all lie on the line y = 2x)
z0 = 1 + 2j  # (1,2)
z1 = 2 + 4j  # (2,4)
z2 = 3 + 6j  # (3,6)

# Create a cline passing through these three points
# Because the points are collinear, this will create a line
cline = Cline.from_three_points(z0, z1, z2)

# Print information about the cline (not shown in output)
print(cline)
print(f"Is circle: {cline.is_circle}")
print(f"Is line: {cline.is_line}")

# Create plot with automatic limits
fig, ax = plt.subplots(figsize=(8, 8))
cline.plot(ax=ax, color='orange', label='Line through 3 collinear points', show_points=True)

# Add a grid to visualize the collinearity
ax.grid(True, linestyle='-', alpha=0.3)

# Add text annotation
ax.text(0.5, 0.05,
       "The points (1,2), (2,4), and (3,6) are collinear\nand lie on the line y = 2x",
       transform=ax.transAxes, fontsize=12,
       horizontalalignment='center', verticalalignment='bottom')

plt.legend()
plt.title('Line Through Three Collinear Points')
(Source code, png, hires.png, pdf)

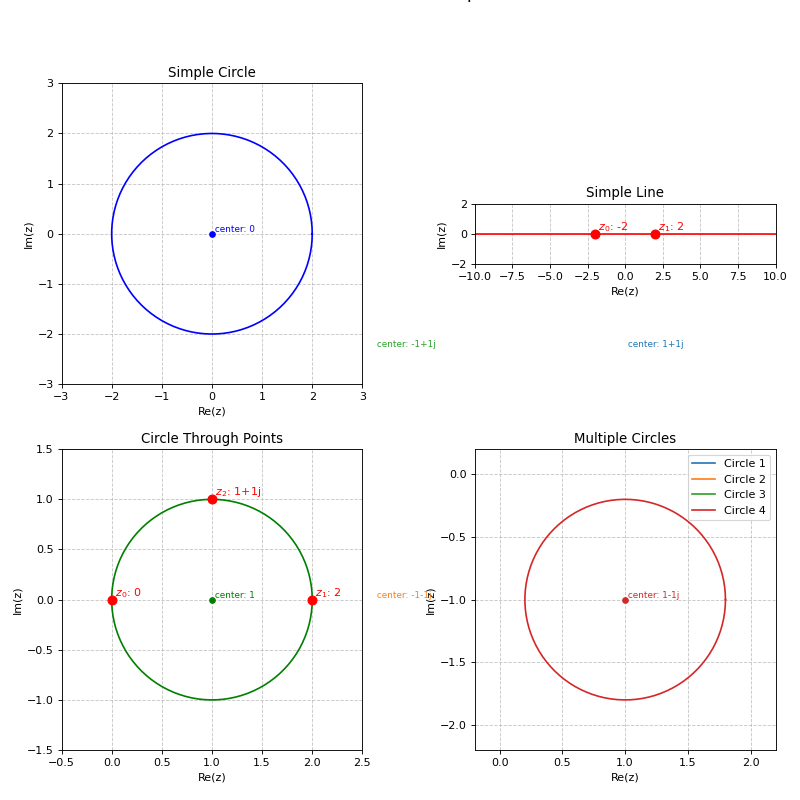
Grid of Clines
import matplotlib.pyplot as plt
from cline import Cline
import numpy as np

# Create a figure with 2x2 subplots
fig, axes = plt.subplots(2, 2, figsize=(10, 10))
axes = axes.flatten()

# Example 1: A simple circle
circle = Cline.from_circle(center=0, radius=2)
circle.plot(ax=axes[0], color='blue')
axes[0].set_title('Simple Circle')
axes[0].set_aspect('equal')
axes[0].grid(True, linestyle='--', alpha=0.7)

# Example 2: A simple line
line = Cline.from_line(z0=-2, z1=2)
line.plot(ax=axes[1], color='red')
axes[1].set_title('Simple Line')
axes[1].set_aspect('equal')
axes[1].grid(True, linestyle='--', alpha=0.7)

# Example 3: Circle through three points
points = Cline.from_three_points(0, 2, 1+1j)
points.plot(ax=axes[2], color='green', show_points=True)
axes[2].set_title('Circle Through Points')
axes[2].set_aspect('equal')
axes[2].grid(True, linestyle='--', alpha=0.7)

# Example 4: Multiple circles
centers = [1+1j, -1-1j, -1+1j, 1-1j]
for i, c in enumerate(centers):
    Cline.from_circle(center=c, radius=0.8).plot(
        ax=axes[3],
        color=plt.cm.tab10(i),
        label=f'Circle {i+1}'
    )
axes[3].set_title('Multiple Circles')
axes[3].set_aspect('equal')
axes[3].grid(True, linestyle='--', alpha=0.7)
axes[3].legend()

# Adjust layout
plt.tight_layout()
plt.suptitle('Various Cline Examples', y=1.02, fontsize=16)
plt.subplots_adjust(top=0.9)
(Source code, png, hires.png, pdf)
