Usage
Creating Clines
The Cline class implements the general equation:
where \(c\) and \(d\) are real numbers and \(\alpha\) is a complex number.
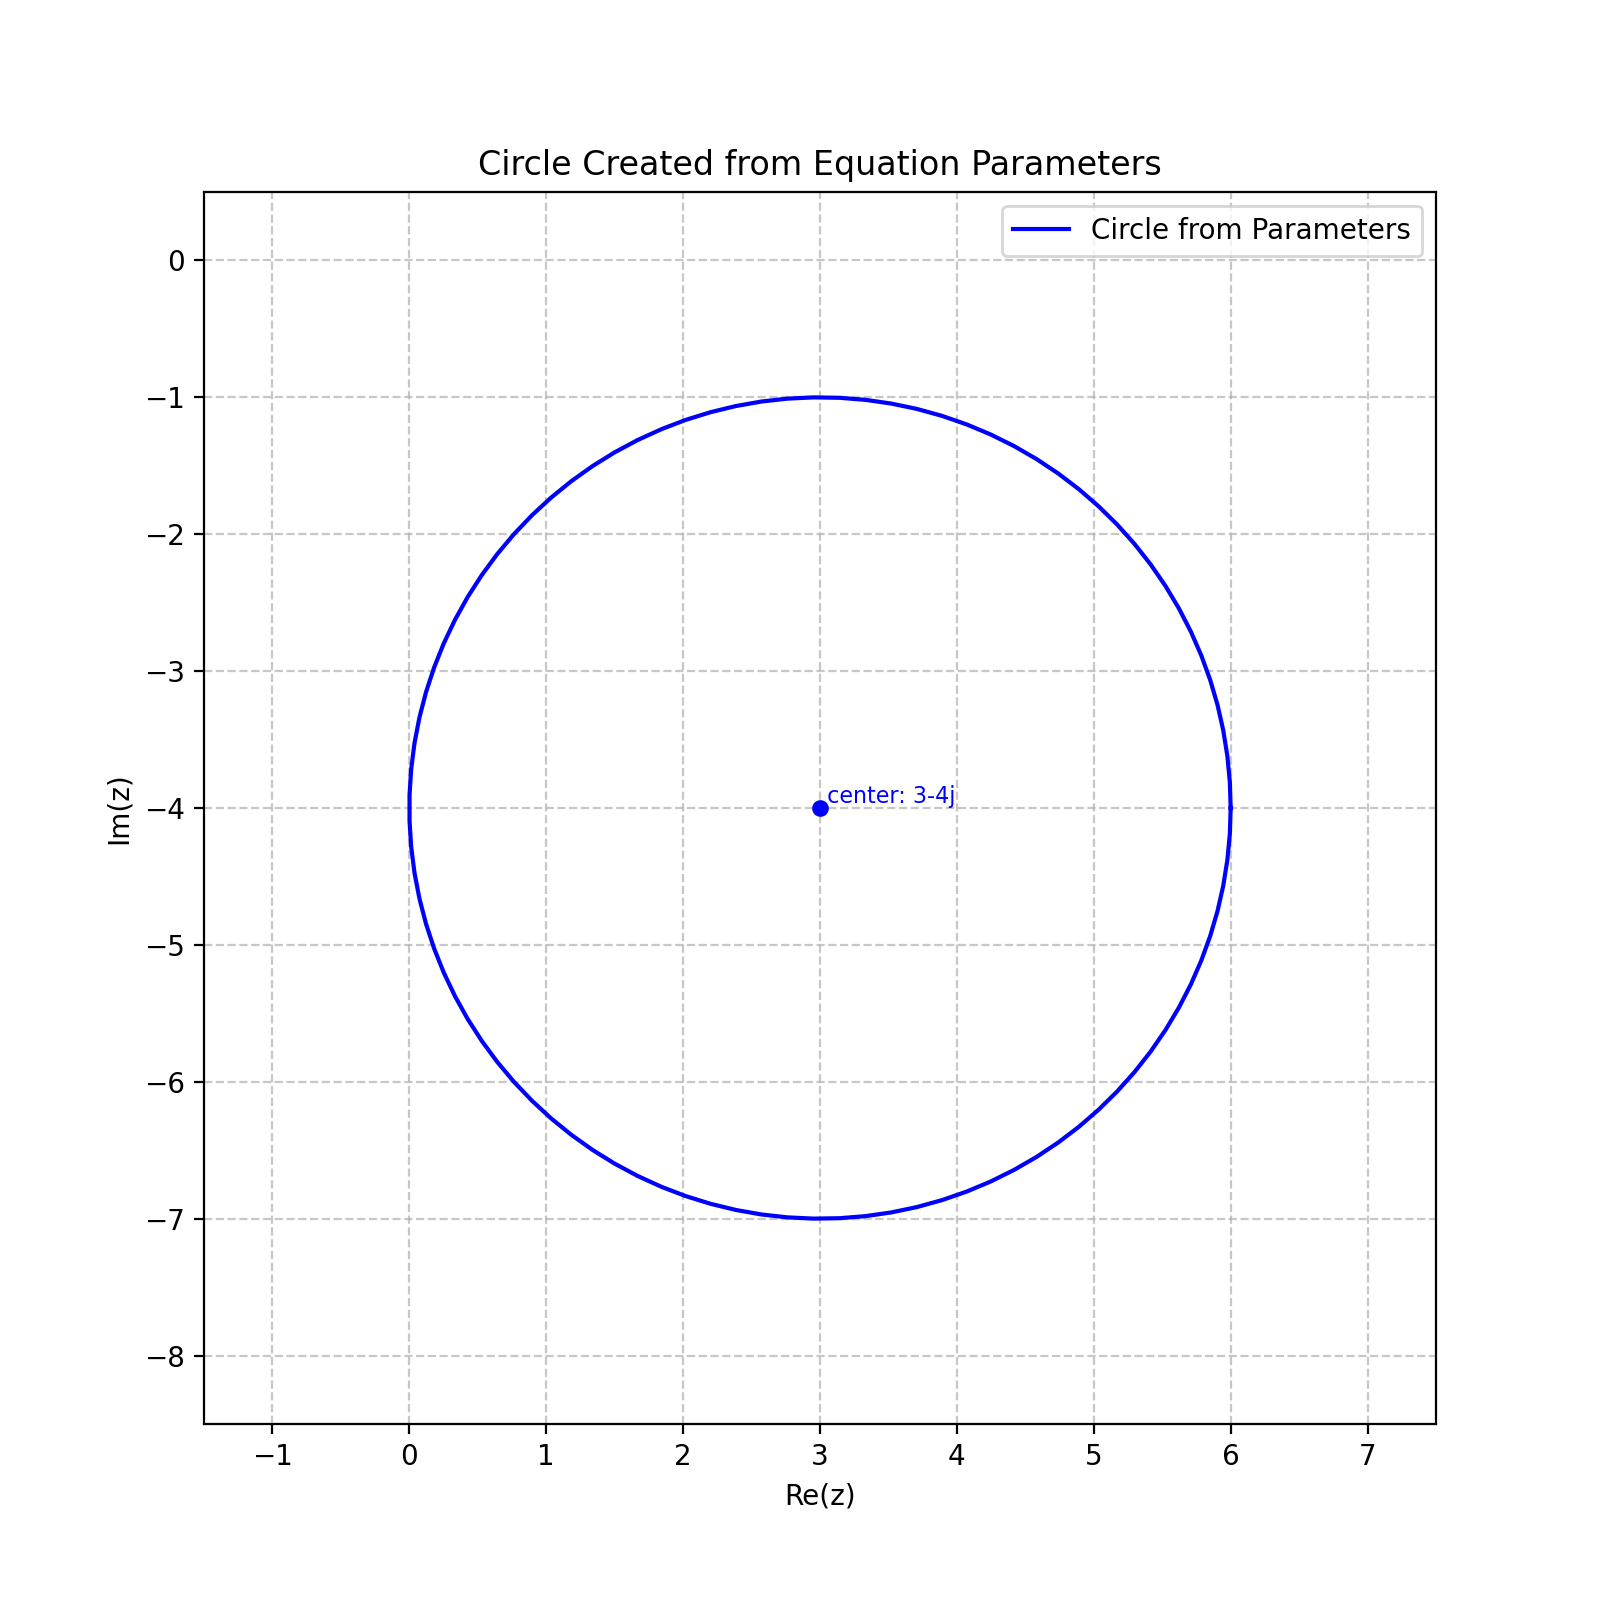
Creating a Cline from Equation Parameters
The most direct way to create a cline is by specifying its equation parameters:
from cline import Cline

# Create a cline using equation parameters
# c=1, alpha=-3-4j, d=16 represents a circle with center 3+4j and radius 5
cline = Cline(c=1.0, alpha=-3-4j, d=16)
print(cline)
import matplotlib.pyplot as plt
from cline import Cline

# Create a cline using equation parameters
# c=1, alpha=-3-4j, d=16 represents a circle with center 3+4j and radius 5
cline = Cline(c=1.0, alpha=-3-4j, d=16)

# Create plot - the .plot() method now calculates appropriate limits automatically
fig, ax = plt.subplots(figsize=(8, 8))
cline.plot(ax=ax, color='blue', label='Circle from Parameters')
plt.legend()
plt.title('Circle Created from Equation Parameters')
(Source code, png, hires.png, pdf)

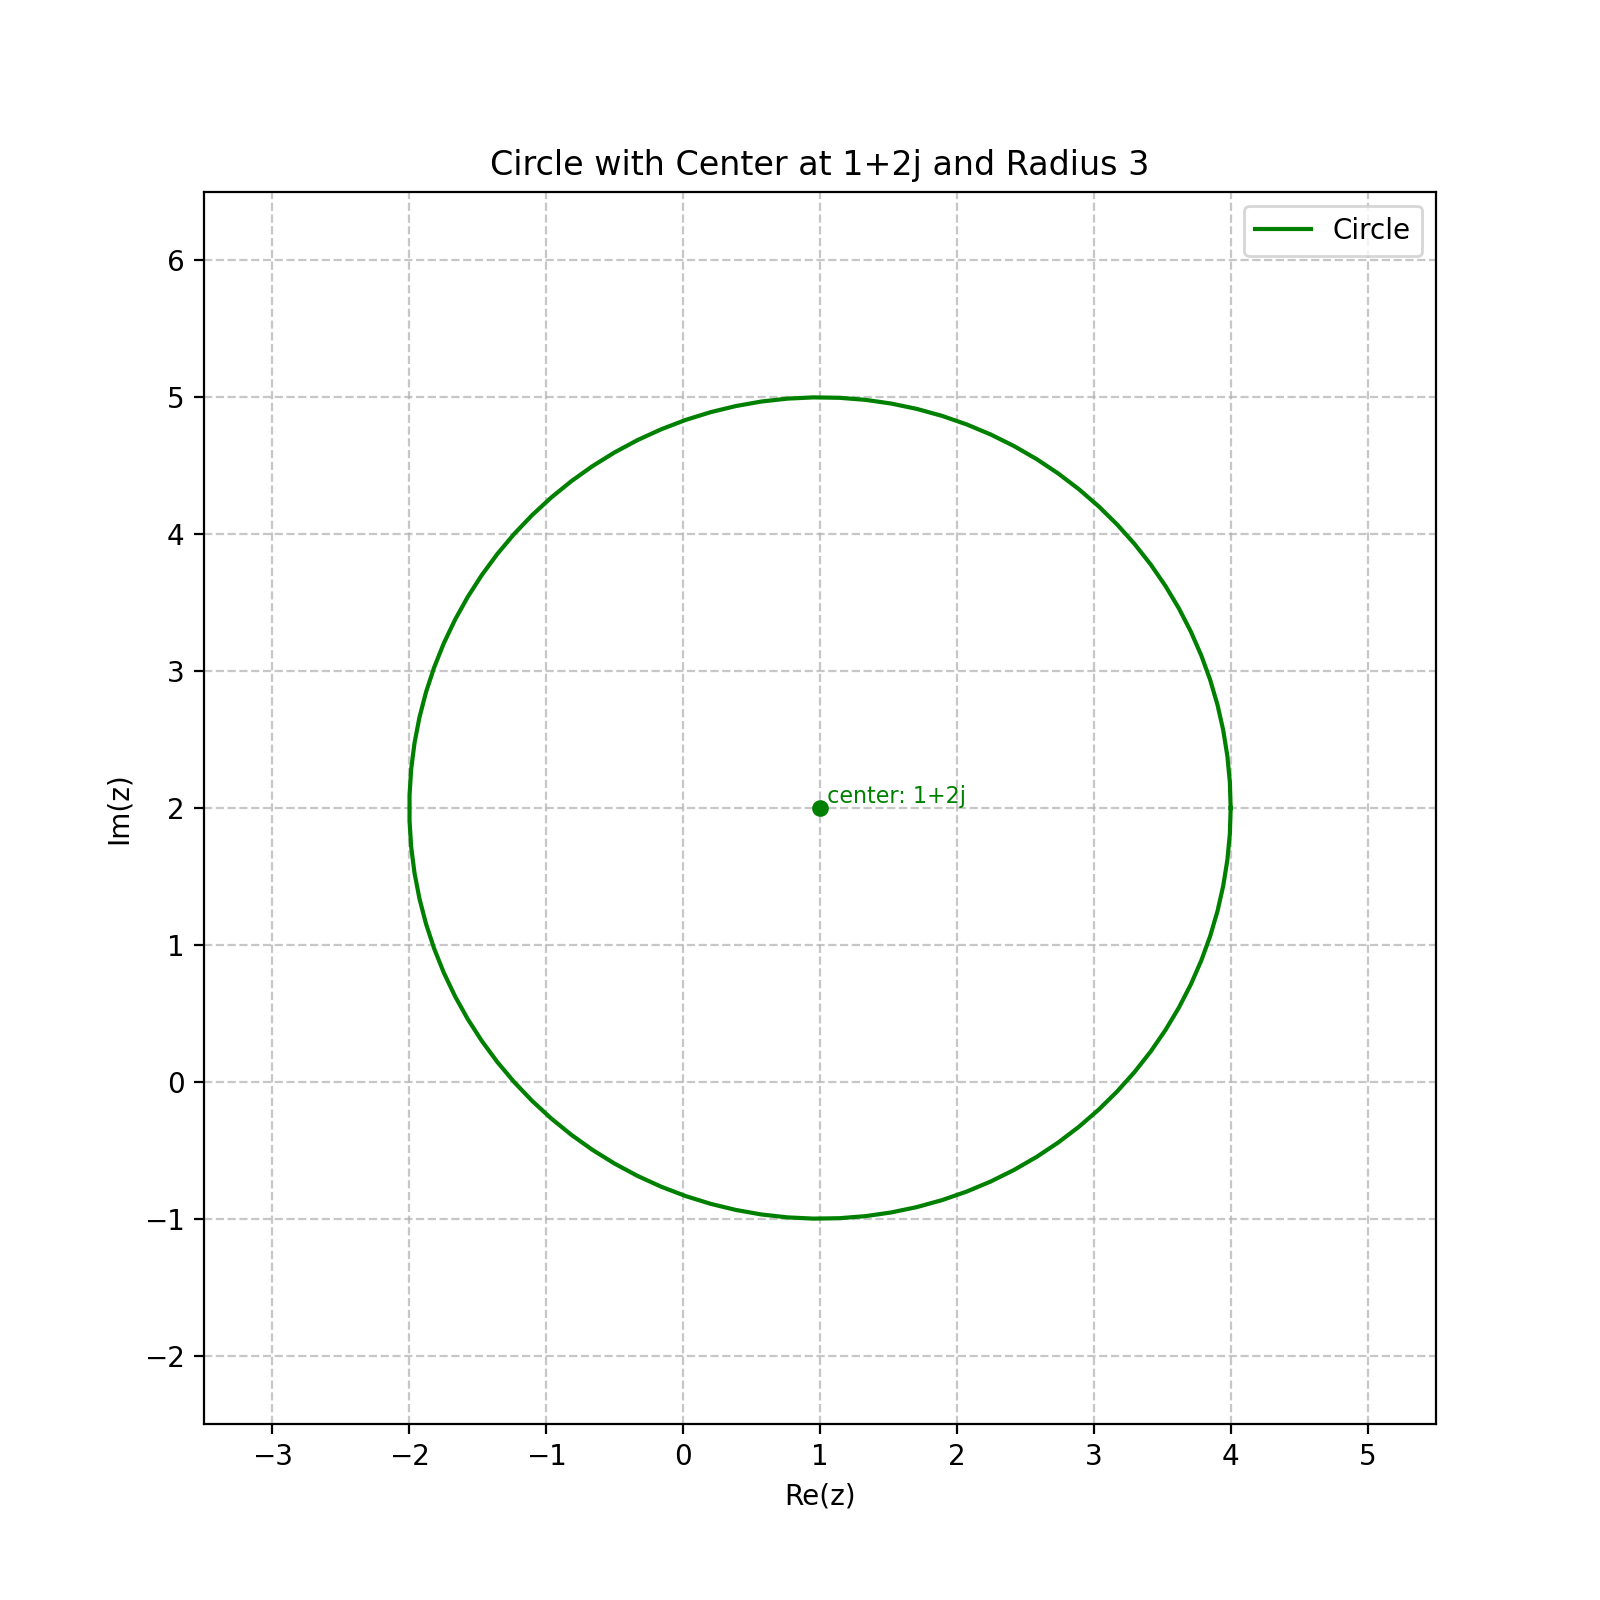
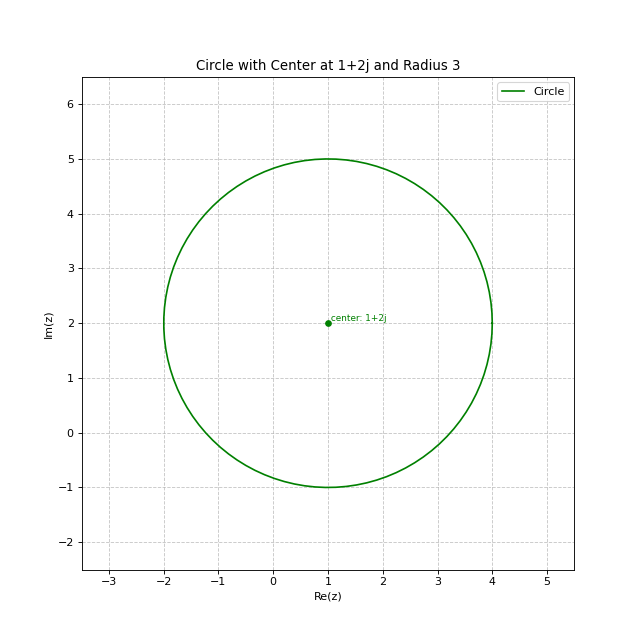
Creating a Circle
You can create a circle by specifying its center and radius:
from cline import Cline

# Create a circle with center at 1+2j and radius 3
circle = Cline.from_circle(center=1+2j, radius=3)
print(circle)
import matplotlib.pyplot as plt
from cline import Cline

# Create a circle with center at 1+2j and radius 3
circle = Cline.from_circle(center=1+2j, radius=3)

# Create plot with automatic limits based on circle center and radius
fig, ax = plt.subplots(figsize=(8, 8))
circle.plot(ax=ax, color='green', label='Circle')
plt.legend()
plt.title('Circle with Center at 1+2j and Radius 3')
(Source code, png, hires.png, pdf)
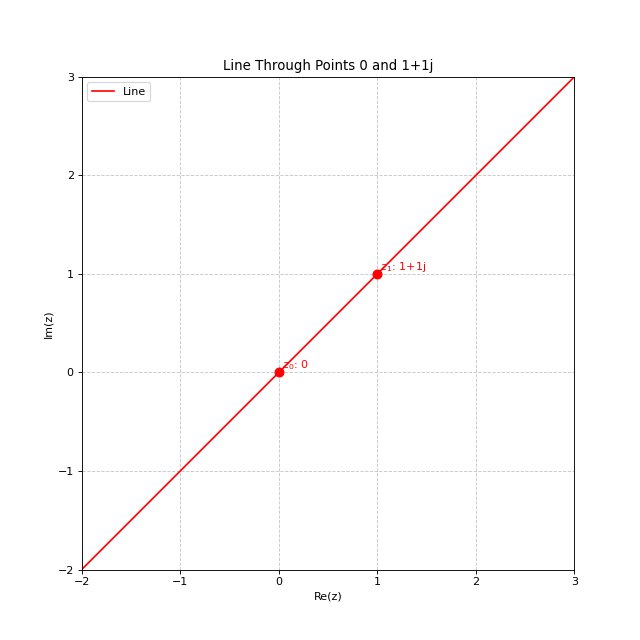
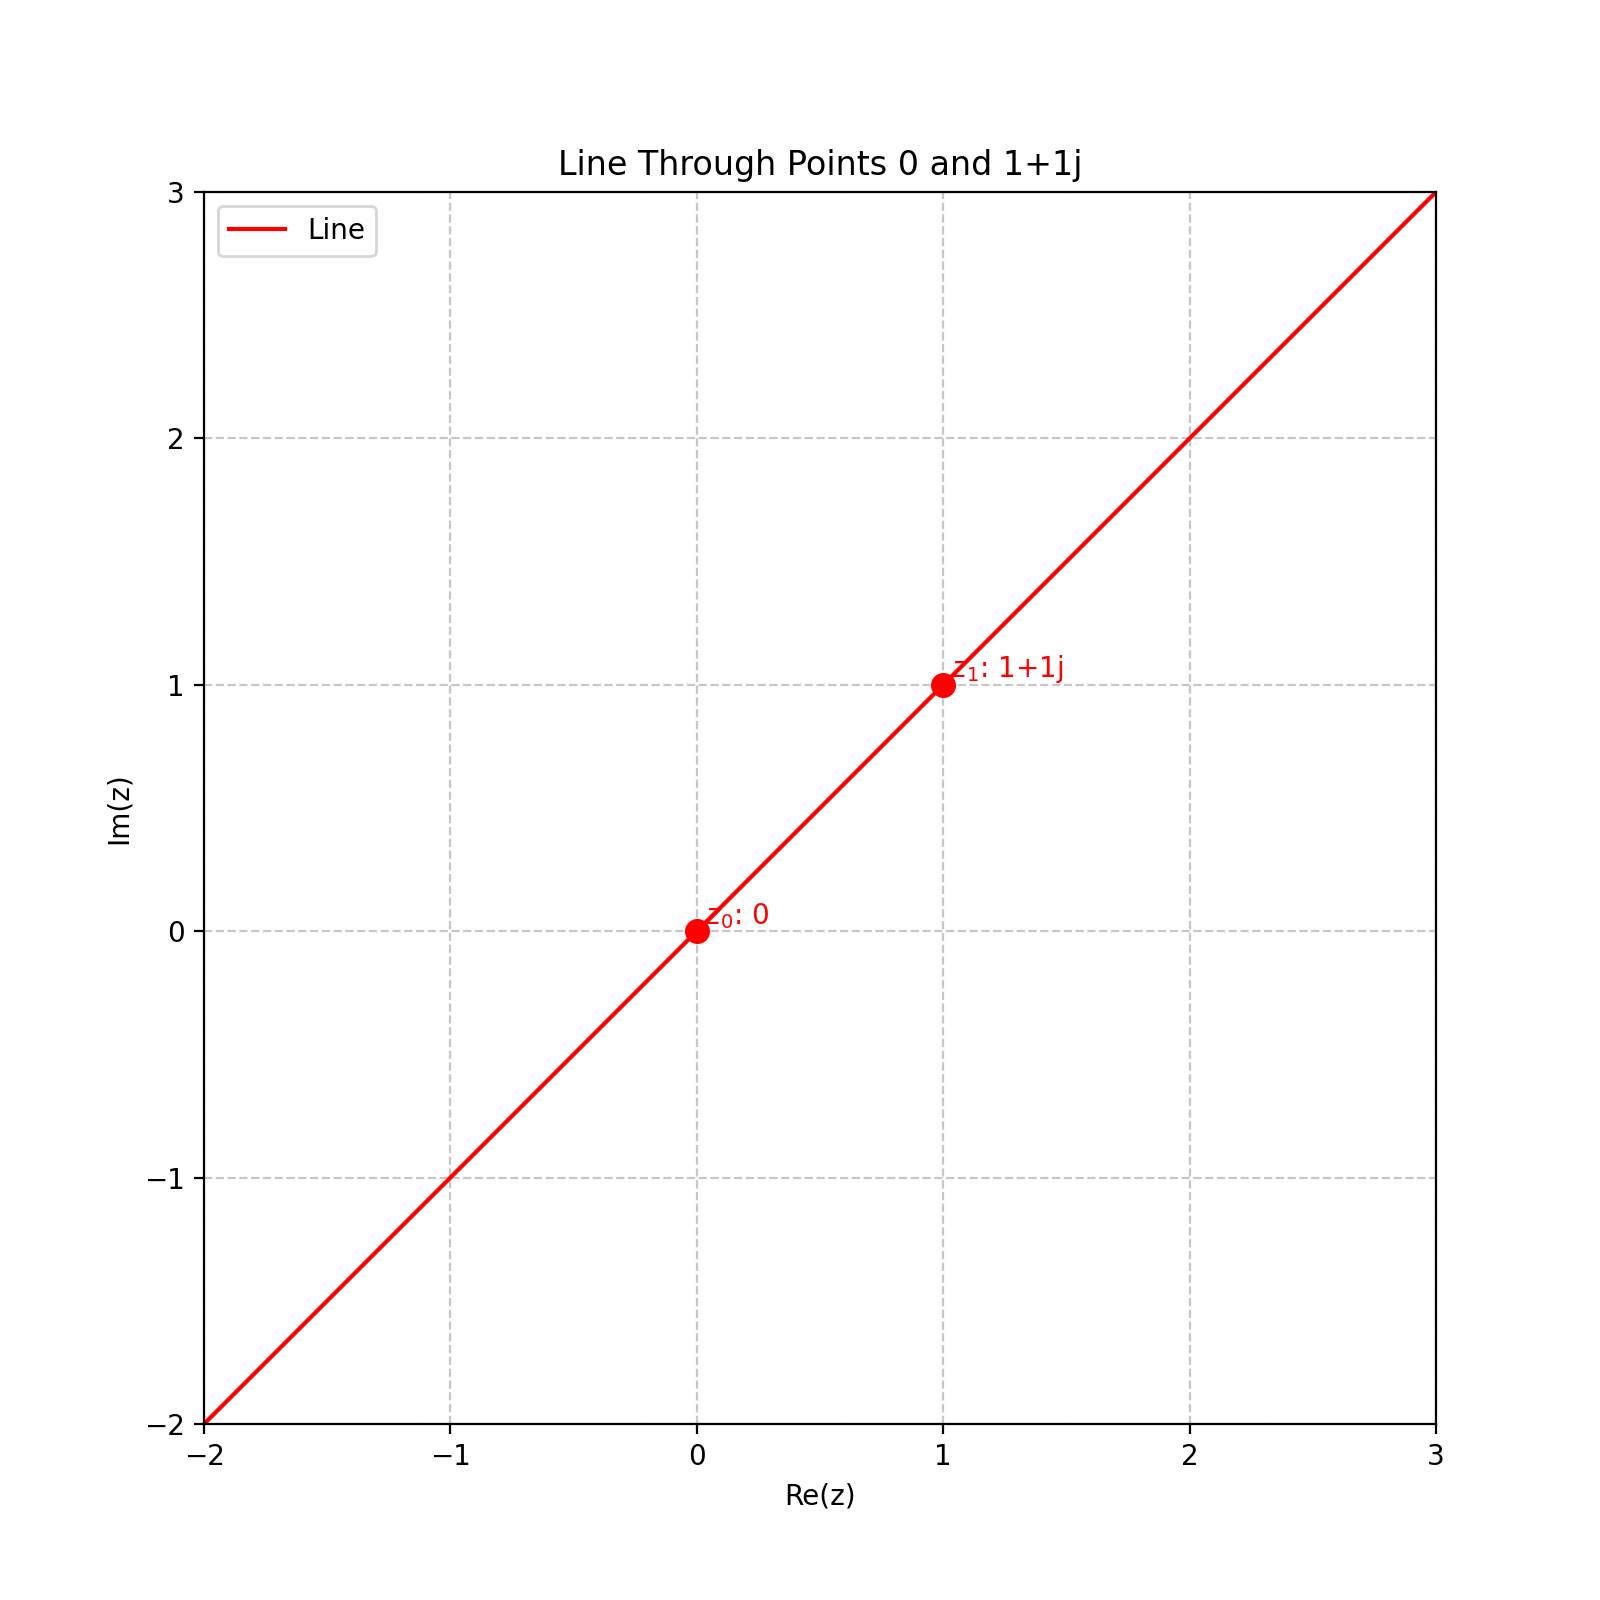
Creating a Line
You can create a line by specifying two points:
# Create a line passing through the points 0 and 1+1j
line = Cline.from_line(z0=0, z1=1+1j)
print(line)
import matplotlib.pyplot as plt
from cline import Cline

# Create a line passing through points 0 and 1+1j
line = Cline.from_line(z0=0, z1=1+1j)

# Create plot - the limits are now automatically calculated
# based on the points used to create the line
fig, ax = plt.subplots(figsize=(8, 8))
line.plot(ax=ax, color='red', label='Line', show_points=True)
plt.legend()
plt.title('Line Through Points 0 and 1+1j')
(Source code, png, hires.png, pdf)

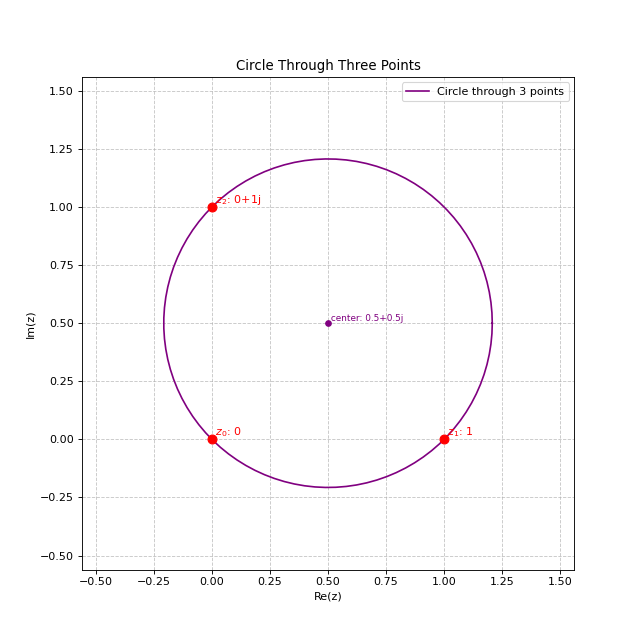
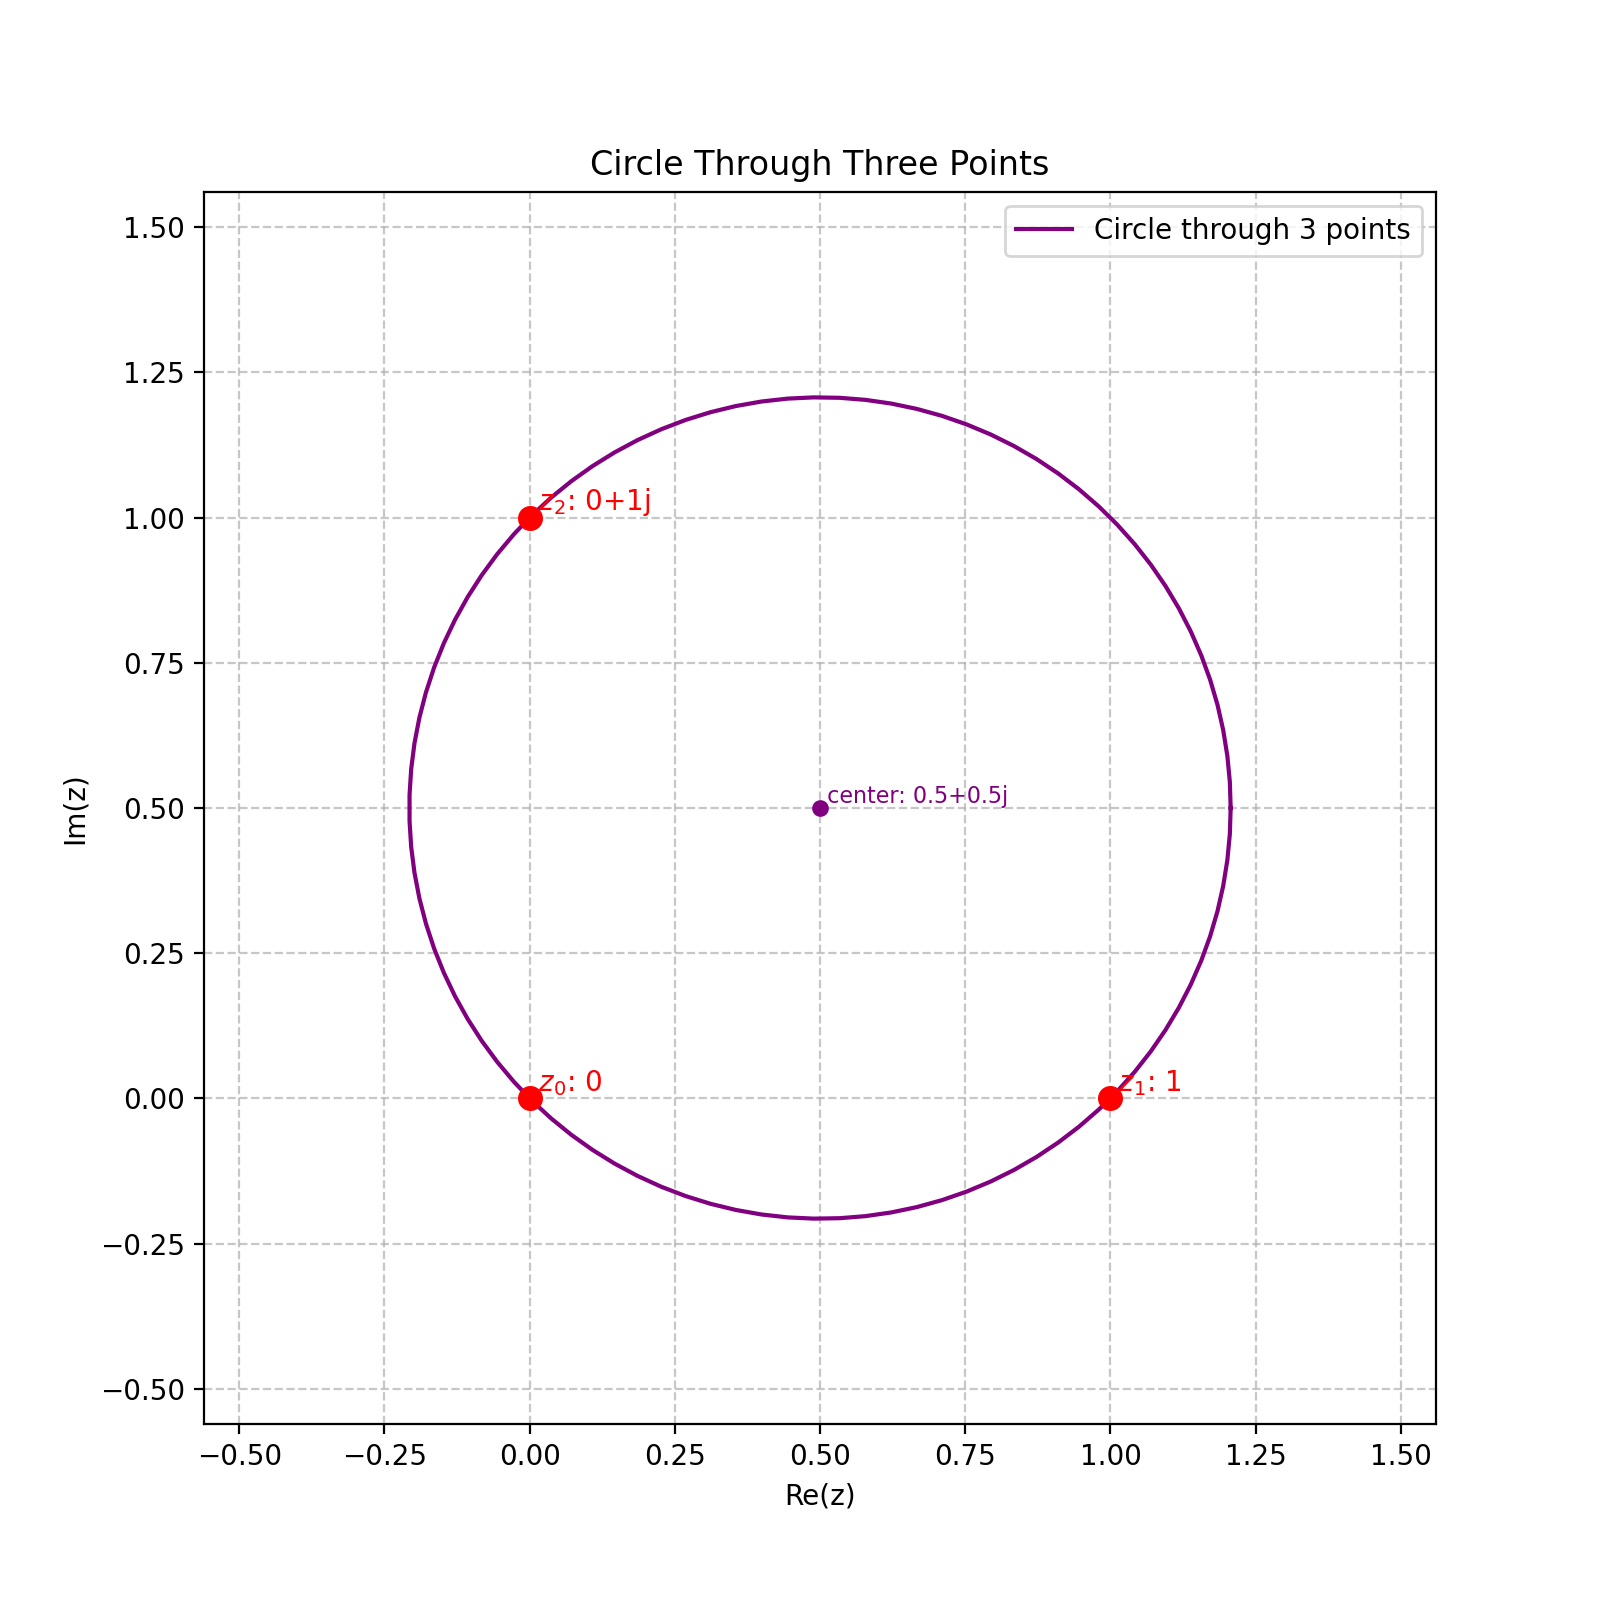
Creating a Cline from Three Points
The most general method creates a cline passing through three points:
# Create a cline passing through three points
cline = Cline.from_three_points(z0=0, z1=1, z2=1j)
print(cline)
import matplotlib.pyplot as plt
from cline import Cline

# Create three points in the complex plane
z0 = 0
z1 = 1
z2 = 1j

# Create a cline passing through these three points
cline = Cline.from_three_points(z0, z1, z2)

# Create plot with automatic limits
fig, ax = plt.subplots(figsize=(8, 8))
cline.plot(ax=ax, color='purple', label='Circle through 3 points', show_points=True)
plt.legend()
plt.title('Circle Through Three Points')
(Source code, png, hires.png, pdf)

This will create a circle if the points are not collinear, or a line if they are collinear.
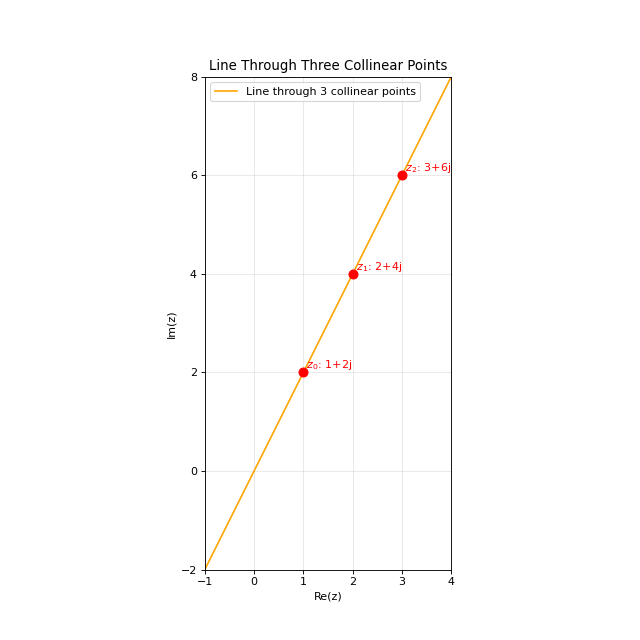
Example: Three Collinear Points
When the three points lie on a straight line, the result is a line:
# Create three collinear points (all lie on the line y = 2x)
z0 = 1 + 2j  # (1,2)
z1 = 2 + 4j  # (2,4)
z2 = 3 + 6j  # (3,6)

# Create a cline passing through these three points
cline = Cline.from_three_points(z0, z1, z2)

# This will be a line, not a circle
print(f"Is circle: {cline.is_circle}")  # False
print(f"Is line: {cline.is_line}")      # True
import matplotlib.pyplot as plt
from cline import Cline

# Create three collinear points (these all lie on the line y = 2x)
z0 = 1 + 2j  # (1,2)
z1 = 2 + 4j  # (2,4)
z2 = 3 + 6j  # (3,6)

# Create a cline passing through these three points
# Because the points are collinear, this will create a line
cline = Cline.from_three_points(z0, z1, z2)

# Create plot with automatic limits
fig, ax = plt.subplots(figsize=(8, 8))
cline.plot(ax=ax, color='orange', label='Line through 3 collinear points', show_points=True)

# Add a grid to visualize the collinearity
ax.grid(True, linestyle='-', alpha=0.3)
plt.legend()
plt.title('Line Through Three Collinear Points')
(Source code, png, hires.png, pdf)
Accessing Properties
Depending on whether your cline is a circle or a line, different properties are available:
For Circles
circle = Cline.from_circle(center=1+2j, radius=3)

# Access circle properties
print(f"Center: {circle.center}")
print(f"Radius: {circle.radius}")
For Lines
line = Cline.from_line(z0=0, z1=1+1j)

# Access line properties
print(f"Normal vector: {line.normal_vector}")
print(f"Direction vector: {line.direction_vector}")
print(f"Distance from origin: {line.distance_from_origin}")
print(f"Point on line: {line.point_on_line}")
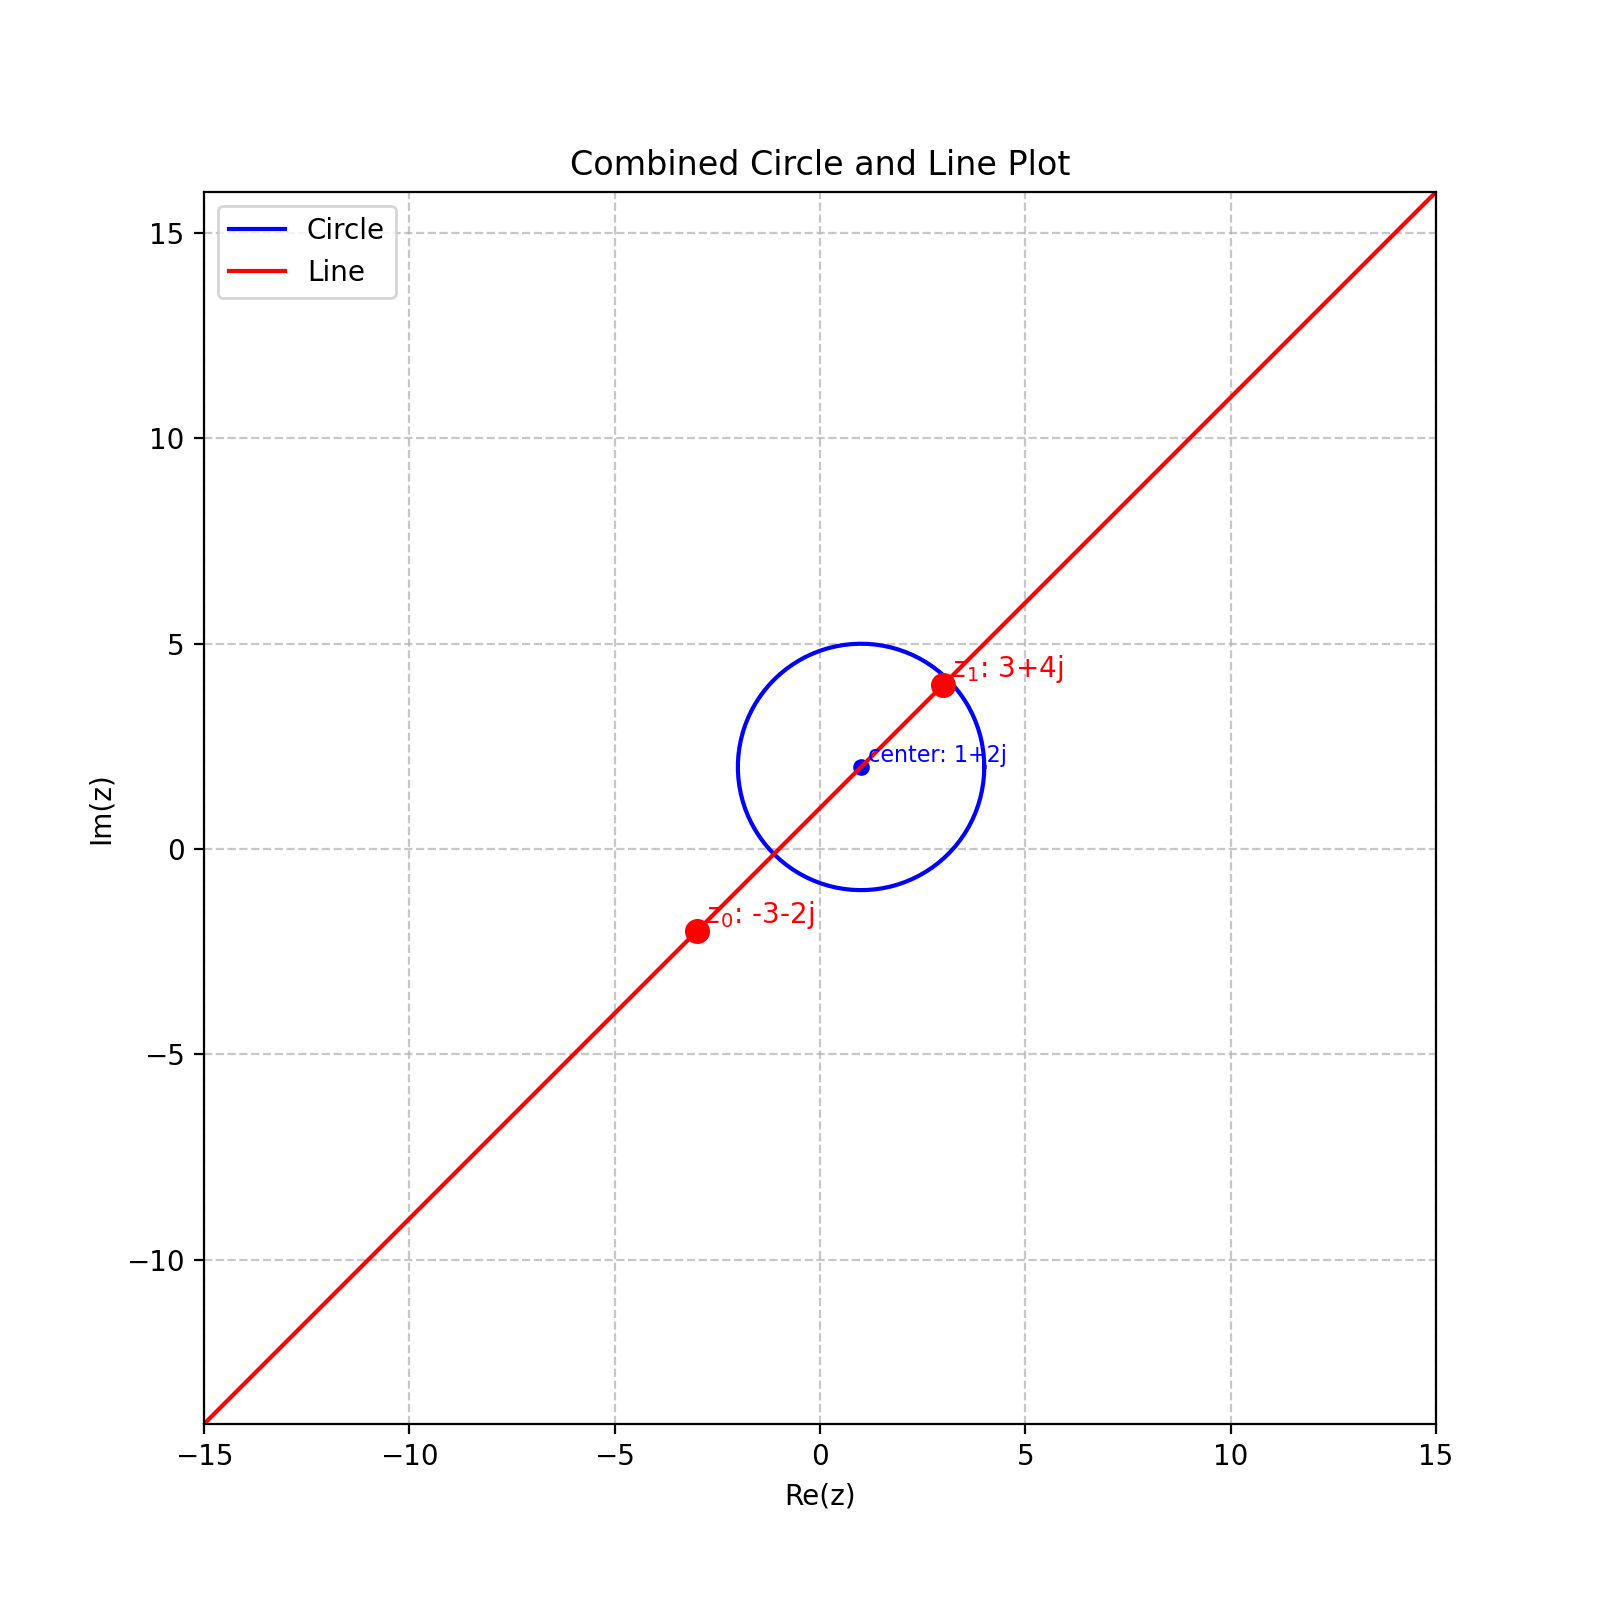
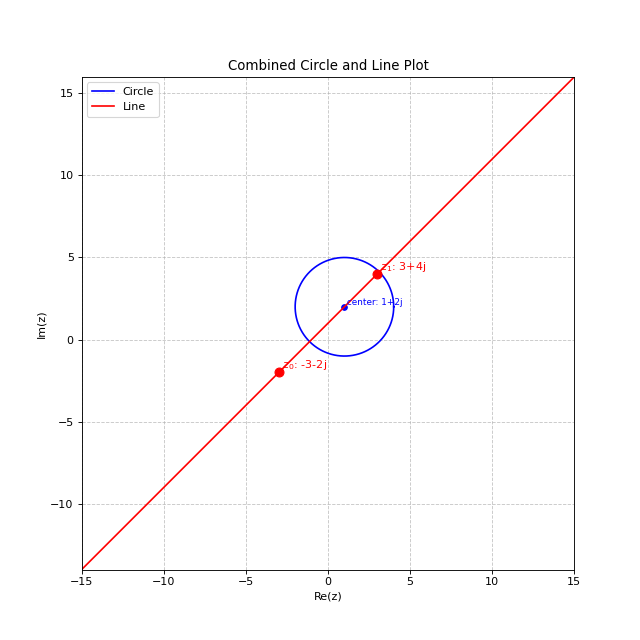
Visualization
Clines can be easily visualized using the built-in plotting functionality:
import matplotlib.pyplot as plt

# Create a figure
fig, ax = plt.subplots(figsize=(8, 8))

# Plot a circle
circle = Cline.from_circle(center=1+2j, radius=3)
circle.plot(ax=ax, color='blue', label='Circle')

# Plot a line
line = Cline.from_line(z0=-3-2j, z1=3+4j)
line.plot(ax=ax, color='red', label='Line')

# No need to manually set limits - they are automatically calculated
plt.legend()
plt.title('Combined Circle and Line Plot')
plt.show()
import matplotlib.pyplot as plt
from cline import Cline

# Create a figure
fig, ax = plt.subplots(figsize=(8, 8))

# Plot a circle
circle = Cline.from_circle(center=1+2j, radius=3)
circle.plot(ax=ax, color='blue', label='Circle')

# Plot a line
line = Cline.from_line(z0=-3-2j, z1=3+4j)
line.plot(ax=ax, color='red', label='Line')

# The plot automatically adjusts to show both the circle and line
plt.legend()
plt.title('Combined Circle and Line Plot')
(Source code, png, hires.png, pdf)
You can customize the plot appearance using various parameters:
cline.plot(
    ax=ax,                  # Matplotlib axes to plot on
    figsize=(8, 8),         # Figure size if creating a new figure
    xlim=None,              # Override automatic x-axis limits if needed
    ylim=None,              # Override automatic y-axis limits if needed
    color='blue',           # Color of the cline
    point_color='red',      # Color of the points used to create the cline
    label='My Cline',       # Label for the legend
    show_points=True,       # Whether to show the points used to create the cline
    num_points=100,         # Number of points to use when plotting a circle
    precision=4             # Number of decimal places for displayed values
)